Quick Navigation
Calculating the Average Value
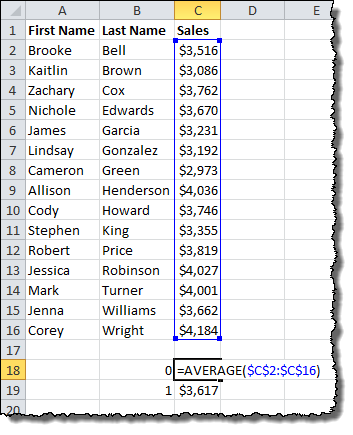
We want to add an average value line to the chart, so we need to build a new series. In an empty space on the spreadsheet, add values for 0 (zero) and 1. To the right, calculate the average of all the sales figures. In the example, the calculation will be as follows:
=AVERAGE($C$2:$C$16)
See the image below for reference:

excellent walkthrough – thanks very much
Excellent! This solved the issue I’ve been working on the entire morning!
Agreed – this is excellent! Thank you – solved the problem I thought I was completely stuck with.
At last. Got the line on my chart. Took a few goes but got there eventually.
Thanks for the explanation. I recorded the steps mentioned above in a macro and used the same in the VBA code.
Great guide, thanks so much. I had almost given up on being able to make the report in Excel the way I’d been asked to!
Just superb, thank you. And thank goodness somebody like you exists to help us all.
Awesome !!! Thanks a ton. This helped me a lot..
Is it just me?
After creating a chart, where is it shown how to add a vertical threshold line?
Thanks,
Hi Bilo!
The article is broken up into steps to make it easier to follow (it’s very long otherwise!). Please click on the link to page 2 at the bottom or go to step 2 in the Quick Navigation box at the top to get to the next step in the process!
Bilo:
No, it’s not just you. At the top of the page in the “Quick Navigation Box” there are links to several pages. The first, “1. Building a Basic Horizontal Bar Chart” shows how to create a chart. In order to add a horizontal line, you need to go through all of the links, from 1 to 5.
Thank you. This is very clearly laid out.
Great walk-through. Very helpful.
Here is another link I found related to Vertical Line Charts
You can check this out for additional information ! 🙂
http://www.goodly.co.in/vertical-line-chart-in-excel/
thank you very much, help me solved my headache
This is really.. Been pulling my hairs to combine a horizontal bar and line chart for a long long time.. Thanks for sharing
Very helpful guide – excellent !
Genius, thank you so much!
Very clear steps. Worked like a charm on Office 365
is there a way to add a coloured vertical box instead of a vertical line?
hi, currently, i’m using your method to have 2 lines to have a “selected area”. do you know if its possible to do a box instead of 2 lines? thank you
Wow, remarkable, haven’t thought that this is possible in excel! Thank you!
Great post. Not at all obvious or easy, but however you worked it out, well done, and thank you for sharing.
This post rocks! Always wanted to do this, would’ve never thought of the scatter plot overlay