Quick Navigation
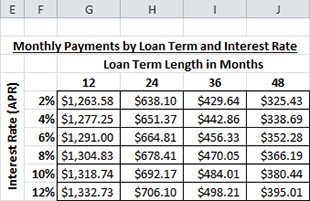 In Part 2, we took our simple car loan calculator and added a breakdown of the payments to learn more about the interest charges. Our calculator can still only look at one set of variables at once. That means that if we wanted to compare different loan lengths (terms) or different interest rates, we’d have to manually enter each combination. Today, it is time to change that. Why do something by hand if we can get Excel to do it for us? Get ready to learn how to use one of the most powerful tools for scenario analysis in the Excel arsenal – the Data Table!
What is a Data Table?
Excel has a suite of tools that it calls “What if Analysis”. They can take control of the variables in your spreadsheet to play around with different outcomes. Data Tables can take one or two variables from your spreadsheet and temporarily change their values. This will affect any formulas in the sheet that use them. The data table lets you choose one formula to “watch” and it saves that formula’s output in a table.
Now that you have the general idea, let’s put it to work for us in the car loan calculator! Wouldn’t it be great if we could see how the monthly payment changed with different interest rates and loan terms? Open your spreadsheet from the last lesson (or you can download the example sheet from Part 2), and make sure you are on the first worksheet, called “Car Loan Calculator”.
Setting Up the Data Table
Start a couple of cells to the right and a few cells down from the inputs for the calculator. I’m starting in F5 on the example sheet.
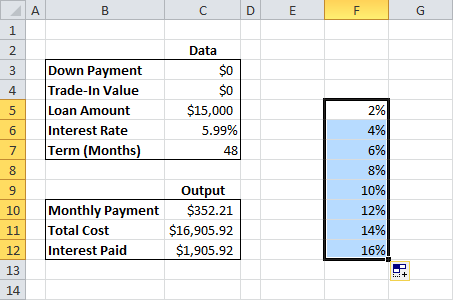
Start filling cells down with common interest rates for car loans. We’re just looking for a range of possible figures. I started at 2% and went up to 16% by twos. You can use the fill-down trick from the last lesson if you want. This will be one of our two variable inputs for the data table.
Next, we need to define our second set of variable inputs. Move to the cell that is up one and the the right one from your top interest rate. In my sheet it is G4.
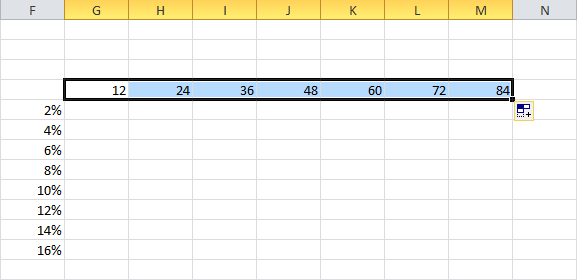
Fill across (to the right) with some plausible car loan terms. Remember, we designed this tool to max out at 120 months, so they have to be no more than 120 for it to work in this example. I started at 12 months and went up to 84 by year increments.
The last thing we need to do is tell Excel what formula we want to “watch” while it changes the variables around. There are a couple of good options, but the most useful is probably the monthly payment amount.
- Click the cell in the top-left corner of your new table. In my example, it’s F4.
- Type “=” to start a formula.
- Click on the monthly payment output cell. It’s C10 for me.
- Press ENTER.
This makes the result from the monthly payment cell show up in our table. It’s not really important to see there – it’s just acting as a reference for Excel to know where to look. I think it’s distracting, so I make the text white. Just click on the cell (F4) and change the text color to white on the Home menu.
Activating the Data Table
Now, we’re ready to go! Select your entire table, starting in the top-left and making sure you cover all the row and column variable inputs we just set up.

With the selection in place, click on the Data menu, select the “What-If Analysis” drop-down menu, and click “Data Table…”

A dialog box will pop up with two data fields. A data table only needs one of them to work, but since we want to change two variables, we are going to use both. Click on the “Row input cell:” field. Then, click on the data cell for the loan term (C7).
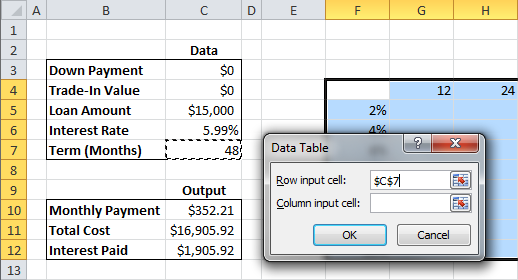
Next, click on the “Column input cell:” field. Then, click on the data cell for the interest rate (C6).
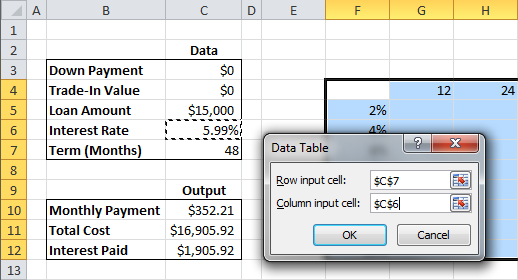
Click OK. That’s it! A little formatting to make things pretty, and your data table is done! The data table is completely dynamic. You can change the Loan Amount and all the values will automatically update!
Using a table like this is incredibly valuable for understanding the trade-off between interest rate and term length for monthly payments. Notice that the longer the term, the more the interest rate matters… If your rate is high, it doesn’t pay to extend your loan term. Play around with different loan amounts in the example below.
Car Loan Calculator Data Table Example
If you want to try another data table, make a new one with the same variables, but have the table watch the Interest Paid cell instead. It’ll show how much the total interest skyrockets as the loan term goes up!
We’ve been able to build a lot of data into the calculator thus far, and it can begin to get a little overwhelming to look at. Come back for Part 4 of this tutorial, when we’ll start to work on ways to visualize all this data!
Love this, very helpful. Do you have anything for the TCO or deprecation? I wanted to compare the loan value to the situation YOY???